


Automating Normal Distribution Analysis with Python and Streamlit
In various fields such as Operational Research, Economics, Social Studies, and Accounting, understanding the distribution of data is essential for making informed decisions. Normal distribution, a fundamental concept in statistics, provides insights into the probability distribution of a continuous random variable. In this blog post, we'll explore how to automate the analysis of normal distribution using Python programming and Streamlit, a popular framework for building interactive web applications.
Introduction
Normal distribution, also known as the Gaussian distribution, is widely applicable across different domains due to its properties and prevalence in natural phenomena. Automating the analysis of normal distribution allows researchers and practitioners to efficiently compute statistical measures and visualize the distribution curve.
Demo Application
Before we dive into the technical details, you can explore a live demonstration of the normal distribution analysis application here. This interactive dashboard showcases the functionalities we'll be discussing in this blog post.
GitHub Repository
To access the code discussed in this post and explore further, you can visit the GitHub repository here.
Objectives
- Compute the Z-score and probability associated with a given value in a normal distribution.
- Plot the normal distribution curve based on the provided parameters.
- Standardize student marks using the normal distribution.
Steps
Importing Python Libraries: We begin by importing necessary Python libraries for data manipulation, statistical computation, and visualization.
Loading Excel File: The dataset, often stored in Excel format, is loaded into our Python environment for analysis.
Computing Z-score and Probability: We compute the Z-score and associated probability using statistical formulas and techniques.
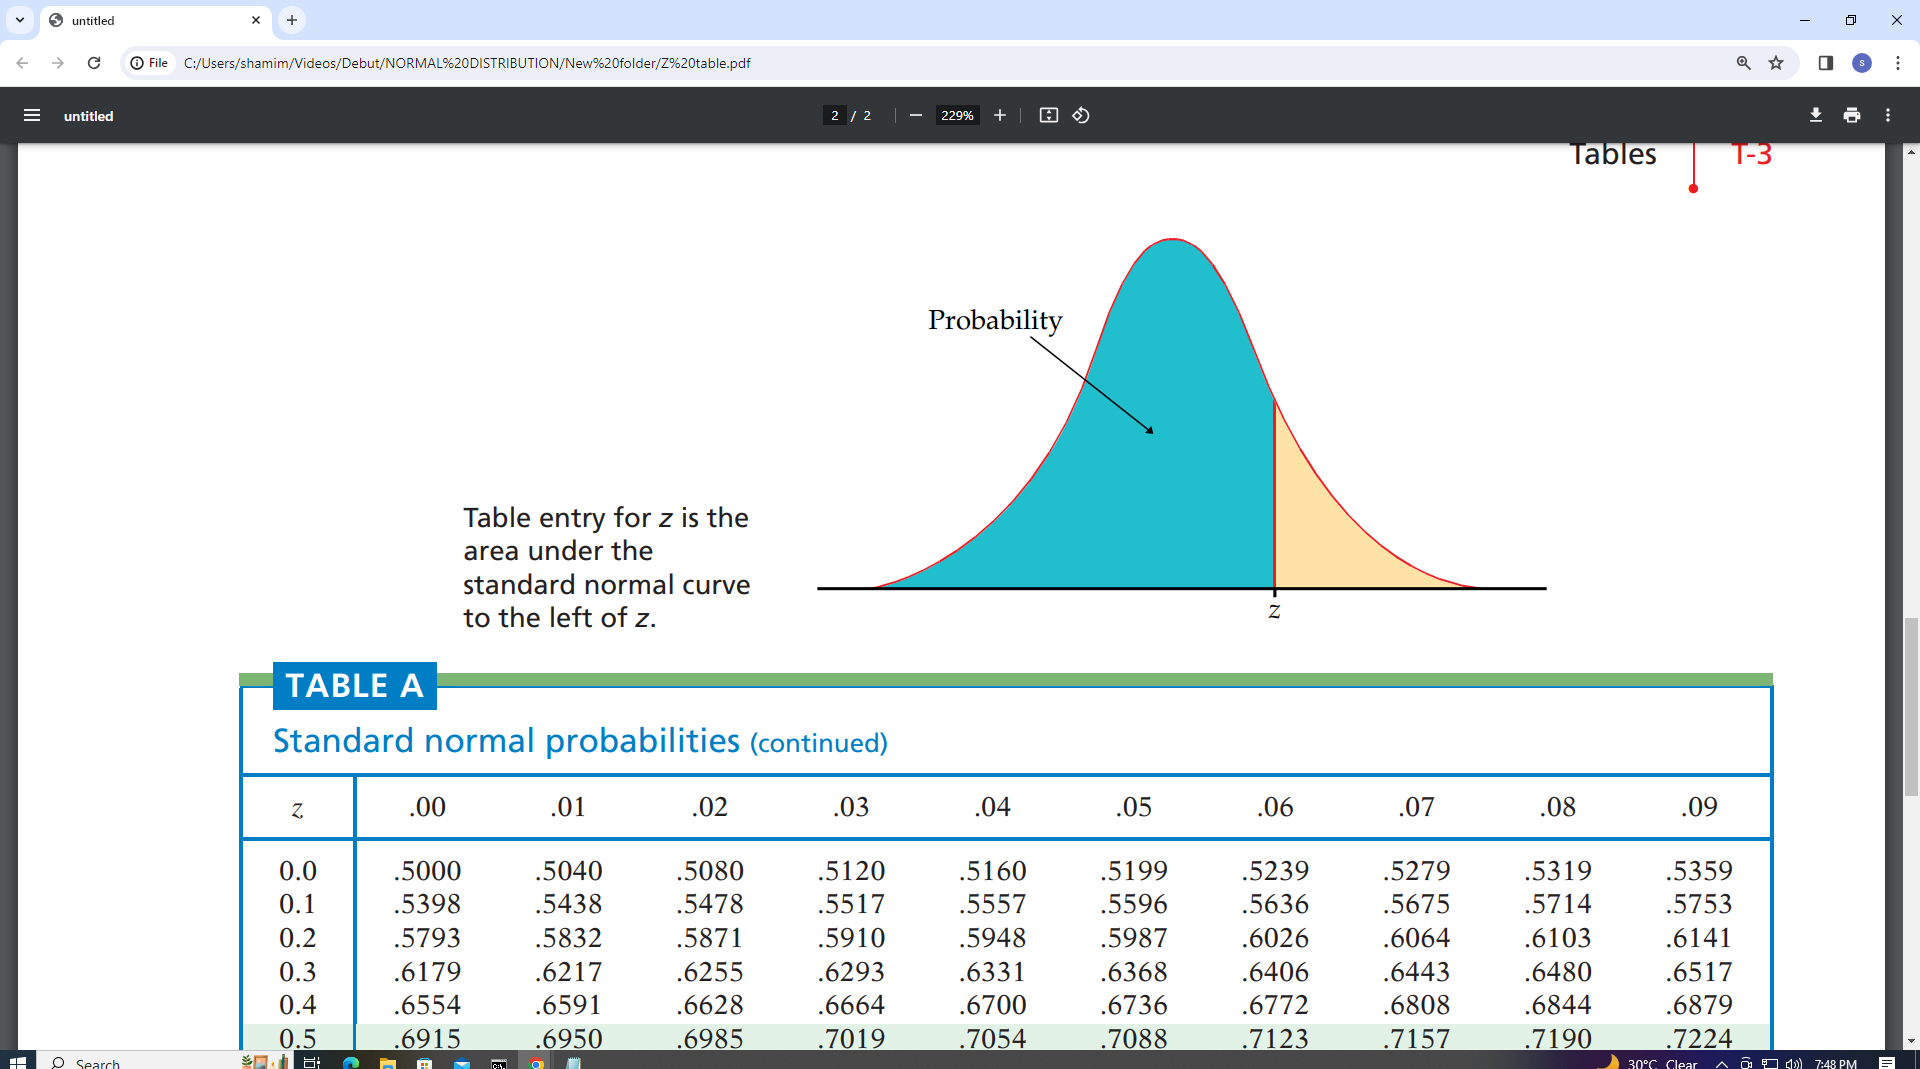
Normal Graphs: Visualizing the normal distribution is crucial for understanding the data. We use Python libraries to plot the distribution curve and visualize the data.
Other Python Projects
In addition to normal distribution analysis, we've developed various other Python projects for data analysis, visualization, and dashboard creation. Here are some noteworthy projects:
- Multiple Linear Regression Web Project using Streamlit and Python
- Python Web Dashboard using DashPlotly Framework and Dash Bootstrap Component
- Business Analytics Dashboard Website using Streamlit Python and MySQL
- Descriptive Analytics Website with MySQL
- Python Machine Learning Web App for Multiple Linear Regression
- Analytics Dashboard with Excel and Graphs
- Web Analytics Dashboard using Python and Streamlit
- Crosstabulation Web Application
- Add New Record to Excel File via Web Interface
- Percentiles, 5 Number Summary, Categorical Data Analysis
- Business Intelligent Analytics Web Dashboard Using Python, HTML, CSS, Streamlit, Microsoft Excel
- Business Analytics Web Dashboard Using Python, HTML, CSS, Streamlit, and Excel as Database
Conclusion
Automating the analysis of normal distribution using Python and Streamlit empowers researchers and practitioners across various fields to gain valuable insights from their data efficiently. By following the steps outlined in this blog post and exploring the provided resources, you can enhance your understanding of normal distribution analysis and leverage it effectively in your work.


No comments:
Post a Comment